Courtesy of Myles Zyblock, Chief Investment Strategist at Dynamic Funds, here is the October 2021 market update:
Global Economy & Equities
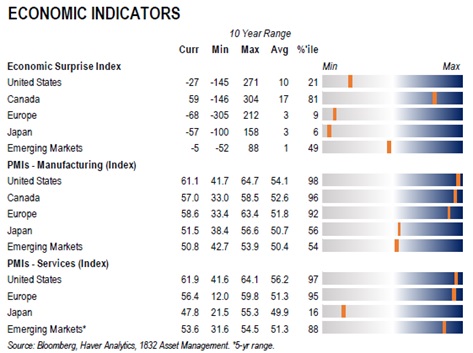
Economic surprise indicators suggest that the number of negative surprises for data releases has been outnumbering the ones with positive surprises. This is generally a sign that economic momentum is slowing – something that is being picked up by other indicators that we track.

- The Economic Surprise Indices suggest that the data has been coming in light relative to consensus expectations. These surprise indices are typically good gauges for the momentum of the economy and they are currently flagging a deceleration in activity.
- On a positive note, leading indicators suggest that the economy, as a whole, should continue to expand. For example, the manufacturing PMIs for U.S., Canada, Europe, Japan and Emerging Markets are all above 50 which point to growth in the coming months.
- Similarly, the Services PMIs are all in expansionary territory as well, with the exception of Japan.
After a rough September, many global equity benchmarks rallied in October and are now back near their all-time highs. As a result, forward P/E multiples for these indices remain in the upper end of the 10-year range.
- The EM region has not yet fully recovered but remains well above the 90th percentile relative to a decade-long history. Forward P/E multiples remain in the upper end of the range, but lower than previous quarters, as the rise in earnings growth expectations have more than offset the price appreciation.
- Among the global sectors, P/Es for Energy and Materials are below the neutral level while Financials is in the middle of its 10-year range. The remaining groups are near the upper end of their respective forward P/E multiple ranges.
Currencies & Commodities
- The U.S. dollar has been strengthening since the end of May but a longer-term view suggests that it is in the middle of a range versus a group of major currencies. It is relatively strong against the Turkish lira, Brazilian real, Japanese yen and South Korean won. Meanwhile, the Swiss franc is the only major currency that the USD is notably weak against.
- Commodity prices have remained firm since our last quarterly update with all the ones we track sitting above historical averages. Natural gas, copper, aluminum, steel and cotton are effectively at or very near their respective decade-long highs.
Fixed Income
- Sovereign yields have moved higher since our last update in July. However, they are mostly below their respective averages for the past decade. Inflation concerns have been supportive of higher yields and with supply chain issues and inventory shortages lingering, the path of least resistance for yields is up.
- While the longer-end of the yield curve has been pushed higher due to inflation concerns, the shorter-end appears more anchored. This is likely due to expectations for central banks, especially in developed economies, to take a slow and steady approach to monetary policy tightening.
- Credit spreads have held at low levels, especially in the U.S. where the investment grade and high yield OAS currently sit near their lowest levels in the past decade. At the same time, corporate spreads for Europe and EM bonds are also relatively tight compared with their respective histories.
Weekly Update – By The Numbers
| North America | Friday Close | Weekly Change | Weekly % Change | YTD % Change |
| Canada – S&P TSX Composite | 21,456 | 419 | 1.99% | 23.08% |
| USA – S&P 500 | 4,698 | 93 | 2.02% | 25.08% |
| USA – Dow Jones Industrial Average | 36,328 | 508 | 1.42% | 18.70% |
| USA – Nasdaq | 15,972 | 474 | 3.06% | 23.93% |
| Gold Futures (USD) | $1,820.00 | $36.10 | 2.02% | -4.13% |
| Crude Oil Futures (USD) | $81.17 | -$2.16 | -2.59% | 67.29% |
| CAD/USD Exchange Rate | $0.8026 | -$0.0048 | -0.59% | 2.12% |
| Europe / Asia | Friday Close | Weekly Change | Weekly % Change | YTD % Change |
| MSCI World Index | 3,232 | 57 | 1.80% | 20.15% |
| Switzerland – Euro Stoxx 50 | 4,363 | 112 | 2.63% | 22.14% |
| England – FTSE 100 | 7,304 | 66 | 0.91% | 13.05% |
| France – CAC 40 | 7,041 | 211 | 3.09% | 26.84% |
| Germany – DAX Performance Index | 16,054 | 365 | 2.33% | 17.02% |
| Japan – Nikkei 225 | 29,612 | 719 | 2.49% | 7.90% |
| China – Shanghai Composite Index | 3,492 | -55 | -1.55% | 0.55% |
| CAD/EURO Exchange Rate | € 0.6935 | -€ 0.0049 | -0.70% | 7.80% |
| Fixed Income | Friday Close | Weekly Change | Weekly % Change | YTD % Change |
| 10-Year Bond Yield (in %) | 1.4530 | -0.1040 | -6.68% | 58.62% |
Sources: Dynamic Funds, Yahoo! Finance, CNBC.com
