As we all know, the tail-end of 2021 and 2022 so far have been challenging to say the least. Inflation – from supply issues, from COVID-related fiscal stimulus, from emergency rate cuts, and from Russia’s invasion of Ukraine – has persistently been well above the Bank of Canada & U.S. Federal Reserve target mandates of 2%. Rate increases to combat inflation have been priced into both equity and bond markets. There is growing fear of a recession. Economic news is pessimistic.
With that said, we would like to present 4 charts that offer some cause for optimism.
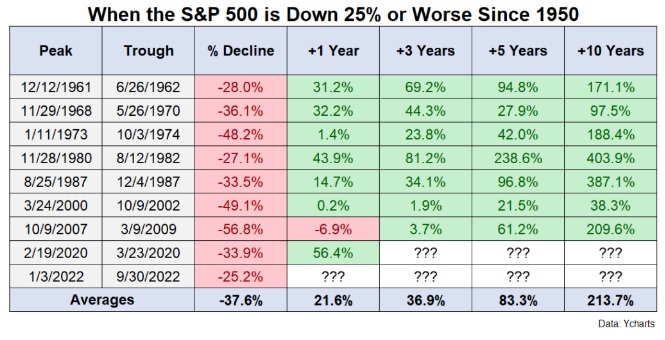
Returns following a 25%+ market decline
Historically, when markets decline 25% or more, the next 12 months look attractive; also, longer timeframes (3, 5, and 10 years from the 25% decline) look more and more attractive. This is the case even if markets decline further before stabilizing.

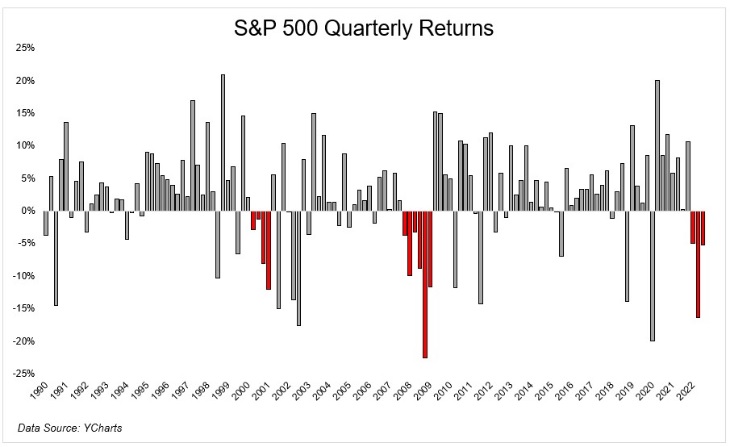
S&P 500 Quarterly Returns
For just the third time in at least 30 years, the market has experienced three consecutive negative quarters.

Market sentiment
Market sentiment is back to extreme fear.
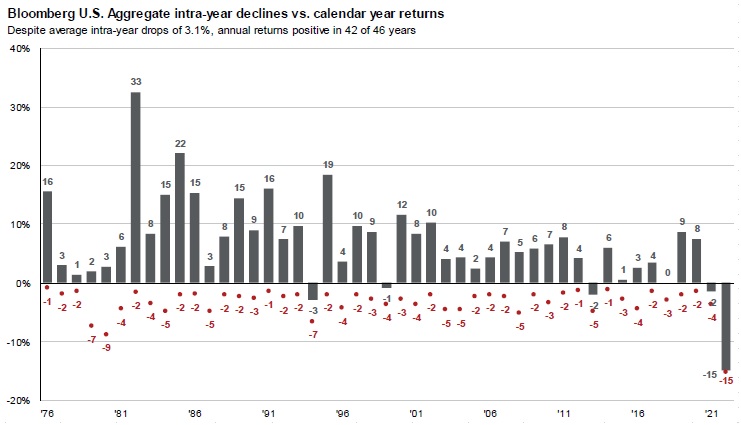
Fixed income
Bonds are having their worst year since at least 1976 (but are usually a mean-reverting asset class).

Conclusion
We say this often, because it’s always true: time in the market is more powerful than timing the market. Taking advantage of a market decline doesn’t require perfectly timing the market bottom (which is virtually impossible). Historically, money invested in similar market conditions – even if it declines in the short term – and held over several years has resulted in positive returns almost universally over 3, 5, and 10 year time periods. The longer you are invested for, the greater the probability of a positive outcome.
Do not hesitate to reach out with any questions you might have.
Sources: Fidelity Investments
