The yield curve inverted, and the DOW dropped 800 points. Now what?
Yesterday, the DOW dropped 800 points, the single largest drop of 2019. This was largely due to news that the yield curve had – briefly – inverted.
It is important to note that yesterday’s yield curve inversion was only temporary, as the 10-year yield rose back above the 2-year yield to finish the day. Temporary yield curve inversions, if returning to “normal” within a short time period, generally are false signals. It is indeed possible that we will not see an extended yield curve inversion in the short term. Only time will tell.
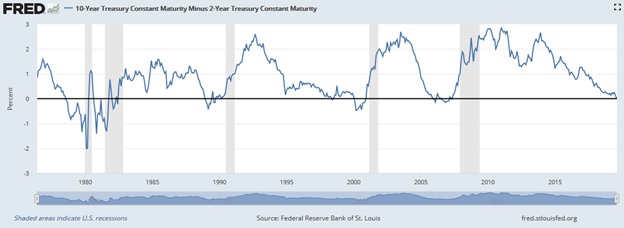
In the investment world, the inversion of the yield curve has been one of the most reliable predictors of a future recession. We wrote about this in our September 2018 e-newsletter article.
In a normal bond environment, long-term bond yields are higher than short-term bond yields, resulting in an upwards sloping curve. Investors expect to be compensated for lending money with a longer duration to maturity, because they are exposed to various risks that are less prevalent in short-term debt instruments. As market expansion continues and central banks raise rates, the yield curves will flatten out and even become inverted, as we are seeing now.
The blue line on the chart below tracks the 10-year treasury yield minus the 2-year yield. When the blue line is below the black horizontal line (0 percent), it indicates an inversion of the yield curve. Shaded areas indicate U.S. recessions. You’ll notice a pretty reliable pattern of the blue line dipping below zero, with a recession following 12-18 months later.

Historically speaking, the inversion of the 2- and 10-year Treasury curve has preceded major selloffs on Wall Street. Yesterday’s drop is consistent with previous inversions in the past. When you consider that the S&P 500 hit record highs in July and is up over 300% since the 2009 financial crisis, the bull market’s vulnerability is coming into sharp relief.
After previous inversions since the 1950s, the S&P 500 has typically fallen about 5% over one or two months, followed by a “last gasp” rally of an average of 17% and lasting about seven months, according to Bank of America.
Equities in some cases continue to climb higher for many months after the yield curve inverted. Since 1980, equities delivered positive one-year returns following yield curve inversions. It is only three years out from the inversion that they have registered significant losses.
S&P 500 corrections related to recessions average 32% and tend to last just over a year, according to Bank of America Merrill Lynch.
What to do?
We cannot control whether the yield curve will invert again and/or how long an inversion will last; however, we can control how your portfolio is constructed. The September 2018 article summarized the following strategies designed to limit downside risk in the later stages of a market cycle:
- Holding more defensive equities
- Avoiding high growth / speculative industries
- Holding more cash
These strategies have likely already been put in place, especially if you have a more conservative risk tolerance, or you are retired and are drawing income from your portfolio.
This office has not changed its stance. For several years, we have described this environment as late-stage and discussed various strategies to mitigate against a correction. The investment philosophy of this office is largely focused on large-cap, blue-chip, dividend investing which delivers steady and stable returns. We don’t engage in overly aggressive, high-risk or speculative tactics that would result in significant losses during a correction.
Unless your risk tolerance, investment timeline, or objectives have changed, we will not recommend a selling of your portfolio in anticipation of a correction. Trying to repeatedly and successfully time market peaks and troughs will very likely be a losing endeavour in the long run.
Despite the headlines, the world is likely not ending. Whether it happens tomorrow or in three years, market corrections are a normal and healthy part of a market cycle and long-term investing. Your portfolio is well managed and well looked after.
Please feel free to contact me anytime with your questions or concerns. I am happy to discuss markets or your portfolio in more detail whenever is convenient for you.
CI Revises Preferred Pricing Program (for CI Unitholders Only)
CI has revised its preferring pricing program.
Previously, clients invested with CI investments would be moved up to different tiers (F1, F2, F3) as their balance exceeded certain thresholds. Moving forward, CI will no longer switch client holdings into another tier, and will instead deposit additional fund units equivalent to the preferred pricing rebate.
Clients who were invested in preferred pricing tiers will have received a letter to explain the change, and to notify the client that fund switches on August 2nd were related to this. This was not a taxable event and client investments have not otherwise changed.
Sources: U.S. Federal Reserve, Bank of America, Globe Investor
